
Poker Tracker App: How Analytics Reveal Your Leaks
You have been studying for weeks. You drill preflop spots, you ask the coach questions, and you do your Daily Spot every morning. But how do you know if any of it is working? Without a poker tracker app turning your study sessions into data, you are flying blind. You might feel like you are improving, but feelings are not a metric.
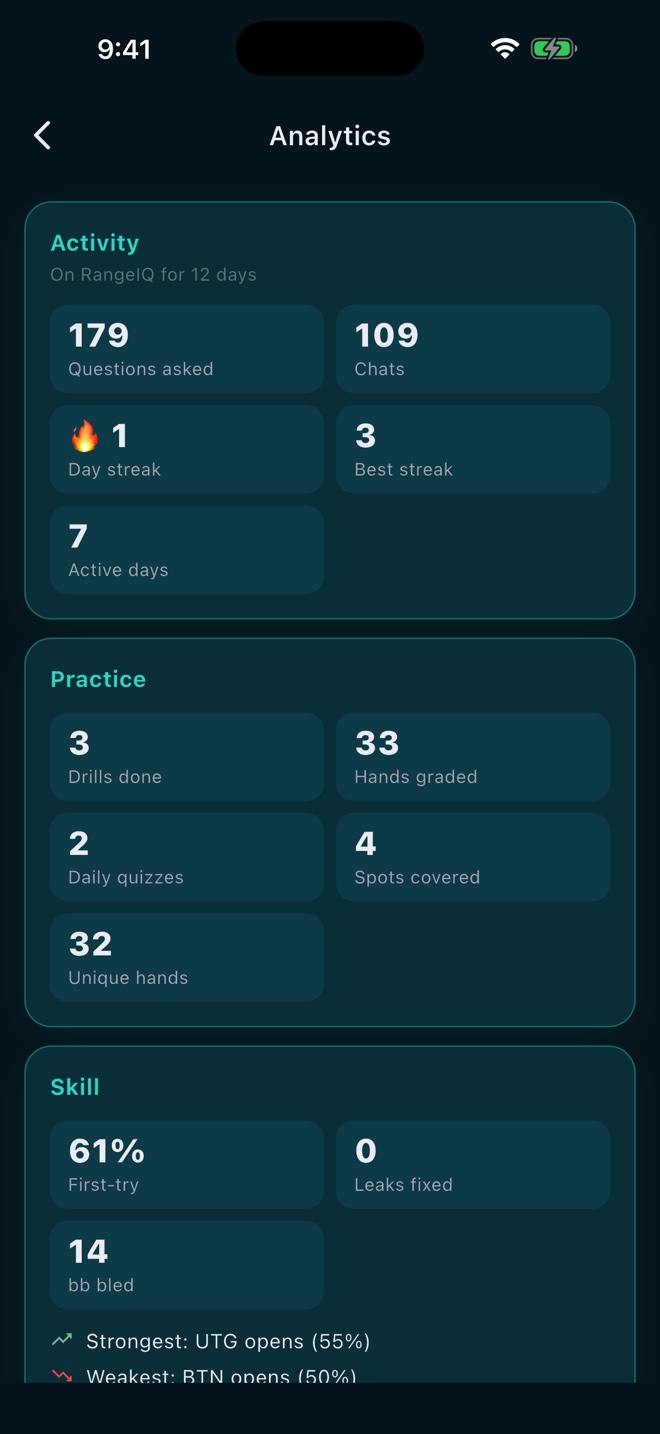
This is where the Analytics screen in RangeIQ comes in. It takes every question you ask, every drill you complete, and every Daily Spot you solve, then turns all of it into concrete numbers you can track over time. No spreadsheets, no manual logging. Just open the gear menu and tap Analytics.
Why You Need a Poker Study Tracker
Most poker tracking tools focus on results: win rate, profit graph, ROI. Those are outcome metrics. They tell you what happened, not why. If your win rate drops, was it preflop leaks? Tilt? Bad runouts? You cannot tell from a graph alone.
RangeIQ takes a different approach. It tracks your study process and your skill growth, not your bankroll. Every time you ask the coach about a spot, every time you answer a drill question, every time you do your Daily Spot, the app records what happened. Did you get it right on the first try? Was it a mistake? How many big blinds did it cost? Over time, these data points paint a clear picture of where your game is strong and where it is leaking.
Think of it as a poker stats tracker for your brain, not your bankroll.
Four Sections, One Complete Picture
The Analytics screen is organized into four sections, each answering a different question about your study habits and skill level.
1. Activity: Are You Putting in the Work?
The Activity section tracks your effort. It shows:
- Questions asked: total coach questions you have submitted.
- Chats: separate conversation threads you started.
- Day streak: consecutive days with at least one study action.
- Best streak: your longest day streak ever.
- Active days: total days with any billable activity (questions or drills).
The day streak is the gamification hook that keeps you coming back. Pair it with the Daily Spot and you have a built-in reason to study every single day. One hand a day keeps the leaks away, and the streak counter proves you are doing it.
2. Practice: How Much Volume Have You Done?
Activity measures input. Practice measures output. This section counts:
- Drills done: complete drill sessions you finished.
- Hands graded: total individual hands the solver has graded across all drills and Daily Spots.
- Daily quizzes: Daily Spots you have completed.
- Spots covered: distinct preflop positions and situations you have studied.
- Unique hands: different starting hands you have encountered across all practice.
Spots covered and unique hands are the diversity metrics. If you have done 200 hands but they are all BTN opens, you have a narrow practice diet. The tracker shows you that so you can branch out.
3. Skill: Are You Actually Getting Better?
This is the section that matters most. It answers the question: is all this studying making me a better player?
- First-try accuracy: the percentage of hands you answered correctly on the first attempt. This is the cleanest signal of skill because it measures recall, not correction.
- Leaks fixed: standing leaks you have successfully corrected. A leak is "fixed" when your latest first-try answer for a (spot, hand) pair is correct.
- bb bled: total big blinds lost across all standing leaks. This is the flip side of your Leak Score, and it is the number that directly impacts your win rate.
- Strongest spot: the preflop position where you have the highest accuracy.
- Weakest spot: the position where you are losing the most big blinds. This is where you should focus your next study session.
First-try accuracy is the key number to watch over time. If it is trending up, your drills are working. If it is flat or falling, you need to change something: either study more frequently, drill your weakest spot, or review the ranges before drilling again.
4. Fun Facts: The Human Side of Your Study
RangeIQ also surfaces a few lighter stats that are surprisingly revealing:
- Nemesis hand: the starting hand you get wrong most often. Maybe it is A5s in the cutoff, or KTo from the hijack. Whatever it is, this is the hand that keeps costing you big blinds.
- Favourite spot: the preflop position you study most. We all gravitate toward what we find interesting, and this confirms it.
- Biggest turnaround: the largest improvement you have made on a single spot, measured in accuracy or bb saved.
Your nemesis hand is not just a fun fact. It is a study target. If the same hand keeps showing up as a mistake across multiple spots, that is a pattern worth drilling until it is fixed.
How Analytics Connects to Your Leak Score
The Analytics screen does not exist in isolation. It works alongside the My Progress sheet, which you can also reach from the gear menu. My Progress leads with your Leak Score: the total big blinds you are bleeding across all standing leaks, with an improving (green, going down) or worsening (red, going up) delta and a sparkline showing the trend.
Where Analytics gives you the broad picture (activity, volume, skill), My Progress drills into the specifics: per-spot mastery bars, a "Work on next" suggestion, and a list of fixed leaks so you can see what you have already accomplished.
Used together, these two screens give you a complete study routine dashboard:
- Check Analytics to see your volume and first-try accuracy trend.
- Check My Progress to see your Leak Score and weakest spot.
- Drill that weakest spot until the Leak Score drops.
- Repeat the next day. Watch the streak grow.
Per Stack Depth Tracking
One detail that matters: everything in RangeIQ is tracked per stack depth. Your 100bb game and your 15bb game are different worlds. A hand that is a clean open at 100bb might be a jam at 15bb, and the solver treats them as separate spots. So your Leak Score, mastery bars, and analytics are all depth-specific.
This means if you play both deep and short, you can see which depth needs more work. Maybe your 100bb game is solid but your push fold ranges at 15bb are leaking. The tracker will show you that, and you can drill the weak depth until it catches up.
What a Good Study Tracking Routine Looks Like
Here is a simple weekly rhythm using the Analytics and Progress screens:
- Monday through Friday: Do your Daily Spot. Ask the coach one question about a spot that came up in your last session. If you have time, run a 10-hand drill on your weakest spot.
- Saturday: Open Analytics. Check your day streak, hands graded, and first-try accuracy for the week. Open My Progress and check your Leak Score trend.
- Sunday: Build a course or run "Review my mistakes" to drill only the hands you keep getting wrong. This is your targeted fix session.
The point is not to study for hours. The point is to study consistently and let the data tell you where to focus. Five minutes a day with the Daily Spot, plus a ten-minute drill on your weakest spot, will move your Leak Score faster than a two-hour session once a week.
The Limits of Tracking (and What RangeIQ Does Not Track)
RangeIQ tracks your study process and your preflop skill growth. It does not track your live results, your bankroll, or your postflop play. The solver covers 6-max No Limit Holdem preflop only: opens and the response to a single open, across ten stack depths from 10bb to 250bb. Postflop, 3-bet pots, and multiway spots are on the roadmap but not covered yet.
This means the Analytics screen is a skill tracker, not a results tracker. It tells you whether your preflop decisions are getting more accurate and whether your leaks are shrinking. That is the most actionable data you can have, because preflop is the foundation everything else is built on.
Start Tracking Your Study Today
If you have been studying without data, you are leaving improvement on the table. You cannot fix what you cannot measure, and you cannot measure what you do not track. RangeIQ gives you the tracker for free: every coach question, every drill, and every Daily Spot feeds the Analytics screen automatically. No extra steps, no manual entry.
Open the gear menu, tap Analytics, and see where you stand. Then tap My Progress and check your Leak Score. The numbers might surprise you, and the weakest spot is your next study target.
Track your leaks with grounded GTO data
RangeIQ logs every drill and coach question, then shows you exactly where your game is leaking in big blinds. Free to start.
Download RangeIQ